Forecasting Your Holiday Return Volume: A Practical Guide for Shopify Merchants

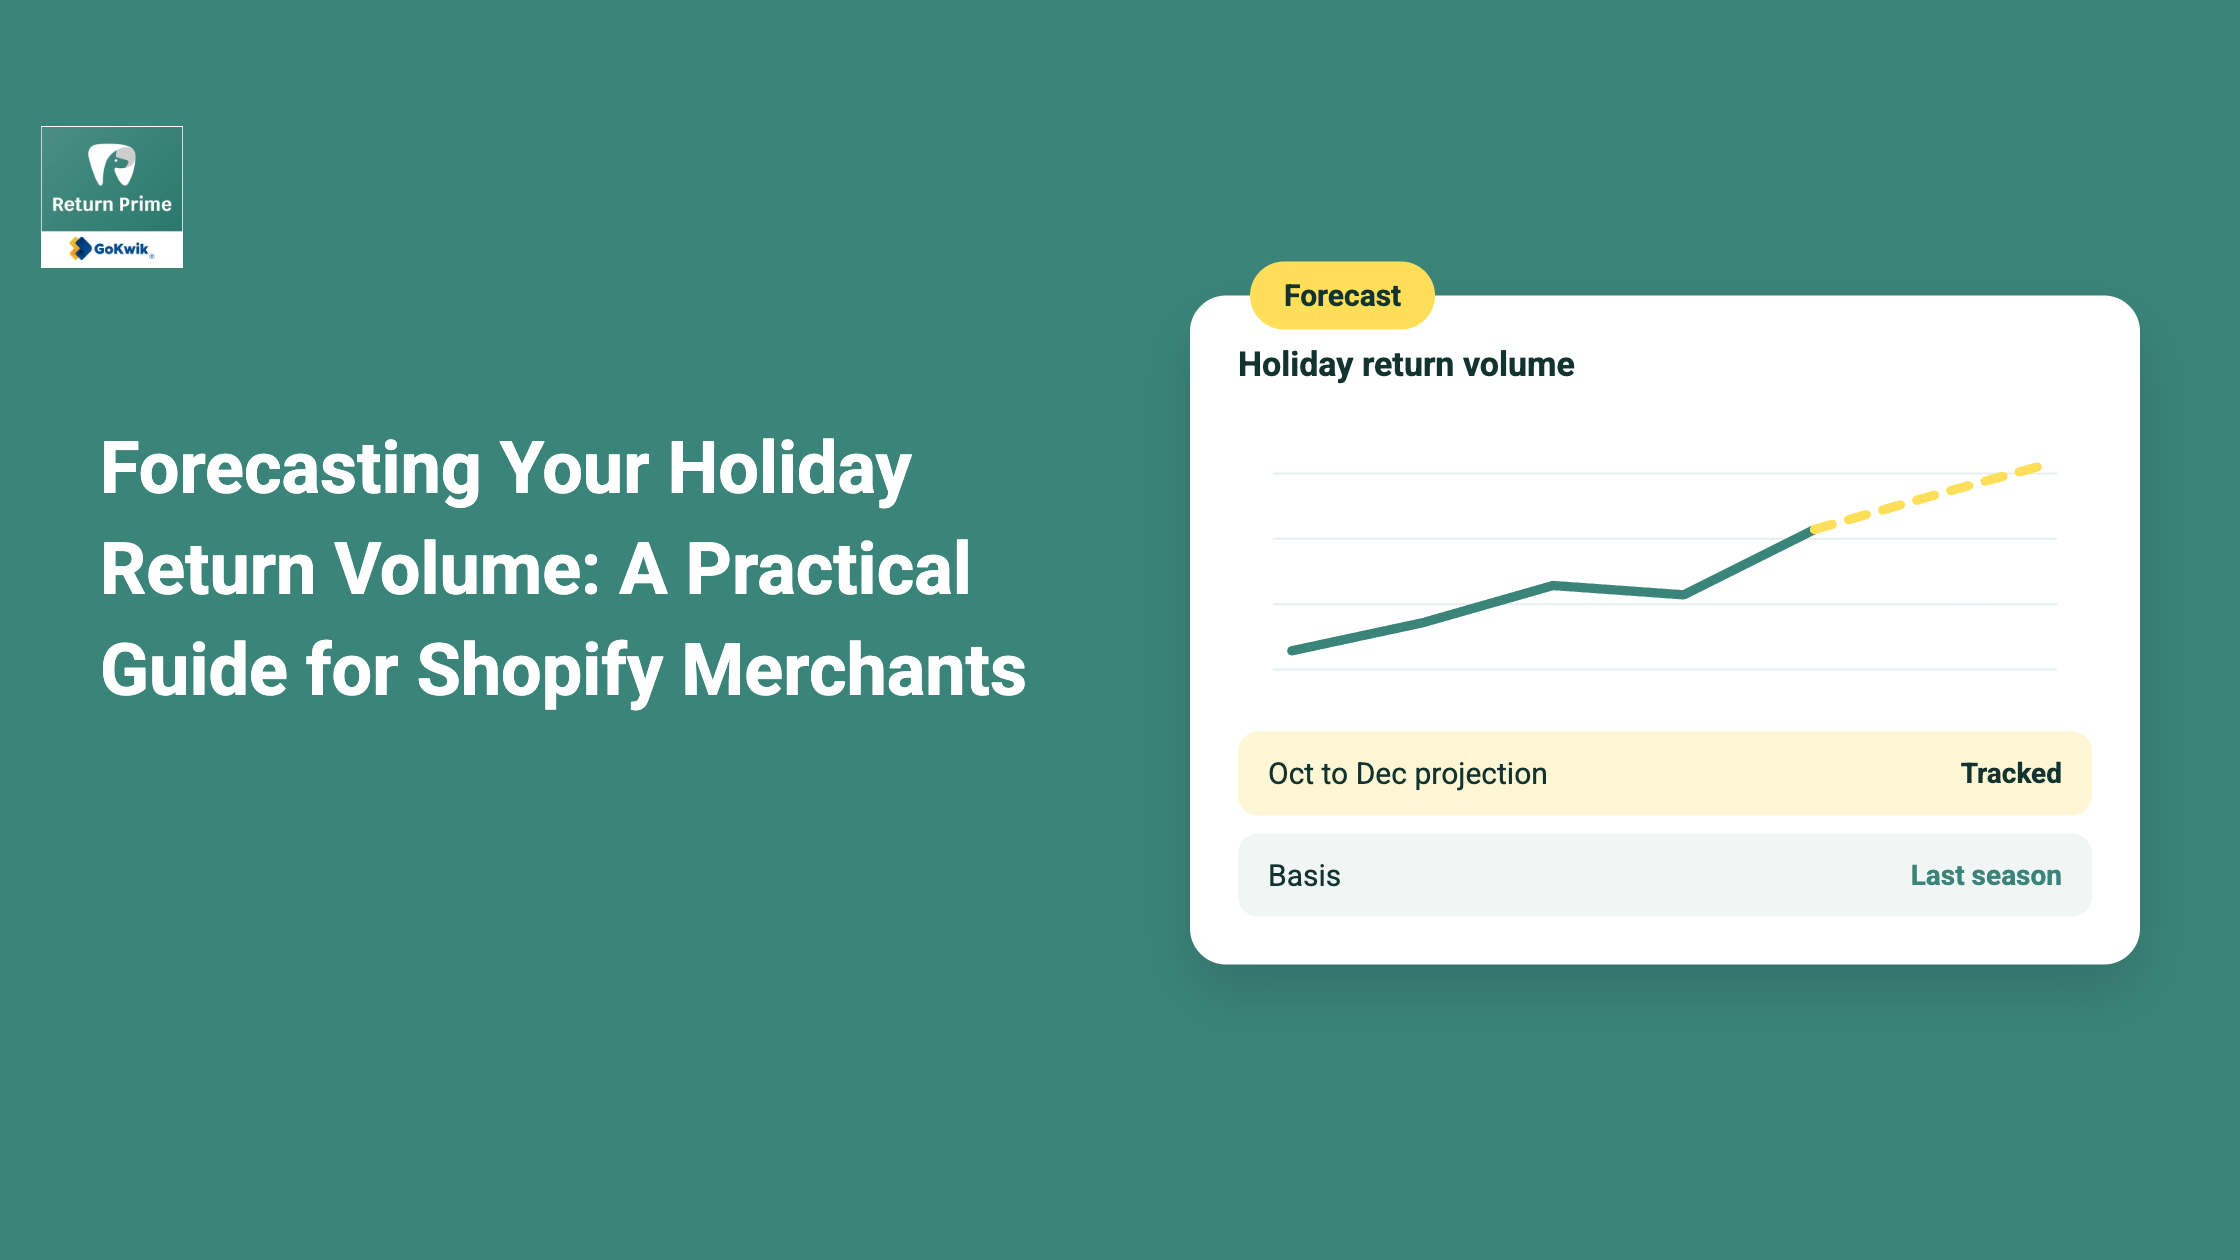
Most merchants forecast holiday sales meticulously and treat returns as an afterthought, something to react to once it arrives. Return volume is forecastable using the same discipline applied to sales forecasting, and doing so is what actually lets you staff, automate, and budget correctly instead of reacting under pressure in real time.
Why return forecasting deserves the same rigor as sales forecasting
Return volume isn't random noise sitting on top of your sales curve, it follows predictable patterns tied to category, occasion, and timing, the same patterns covered throughout this cluster: Diwali's one-to-three-week post-festival lag, Christmas's 10 to 12 week extended return horizon, and January's fraud-share increase even as raw volume drops. A merchant who forecasts sales in detail but treats returns as an unpredictable afterthought is leaving a genuinely modelable variable unmodeled.
The inputs that actually go into a return forecast
Your own historical return rate by category and by season. Last year's actual return rate, broken down by product category and by specific occasion (not just an annual blended average), is your single best predictor, adjusted for this year's sales mix and any policy changes you've made since.
Category-specific industry benchmarks, where your own data is thin. For newer product lines or categories without much of your own historical data, general benchmarks (apparel running 20 to 40%, electronics 8 to 15%, and so on) provide a reasonable starting estimate until your own data accumulates.
Known timing patterns for each occasion you're selling into. Diwali, Christmas, Black Friday, and Singles' Day each have documented, different return-timing curves, covered throughout this cluster, use the specific pattern for each occasion rather than a single generic "returns happen X weeks later" assumption.
Planned sales volume by channel and promotion type. A deep-discount clearance event and a full-price product launch carry different expected return rates; feed your actual promotional calendar into the forecast rather than a flat percentage applied to total revenue.
Any policy or product changes since last year. A new, extended holiday return window, a new gift-return flow, or improved sizing information on product pages should all shift your forecast relative to last year's raw numbers, since you're not comparing like for like otherwise.
Turning a forecast into actual operational decisions
Staffing. A forecasted volume curve, not a flat assumption, tells you which specific weeks need extra support capacity and which don't, avoiding both under-staffing during real peaks and unnecessary cost during quieter weeks.
Automation rule configuration. Knowing expected volume ahead of time lets you set auto-approval thresholds and manual-review triggers deliberately, rather than adjusting them reactively once you're already underwater.
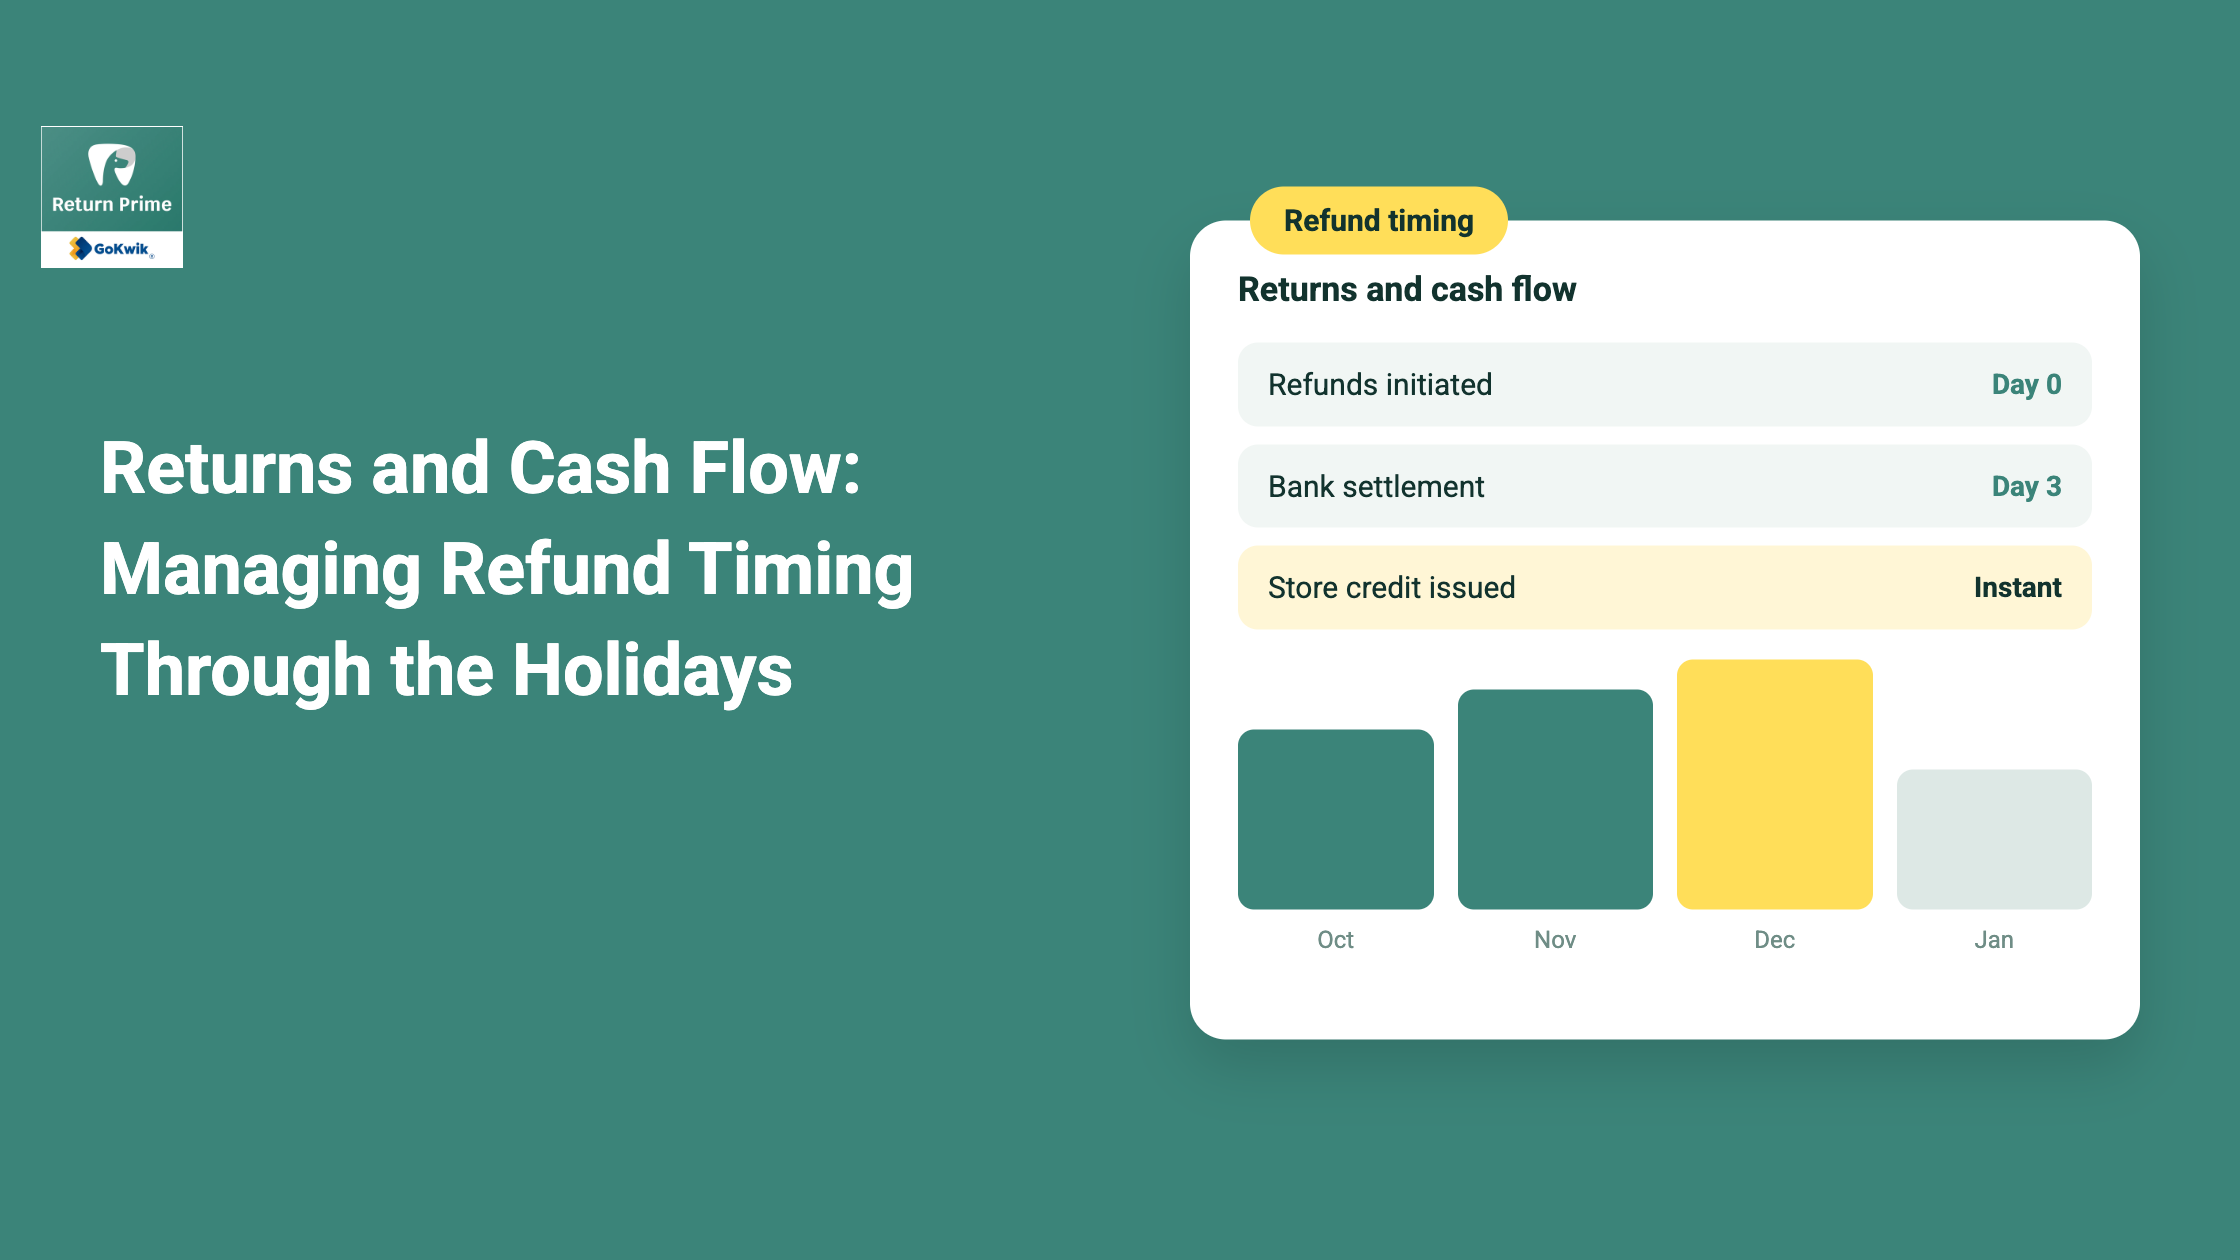
Inventory and cash flow planning. Forecasted return volume directly affects available-to-sell inventory projections and, as covered in our returns and cash flow guide, expected refund liability timing.
What good forecasting looks like in practice
A merchant that pulls last year's category and occasion-specific return data, adjusts for this year's sales mix and policy changes, layers in the documented timing curve for each specific occasion they're selling into, and uses the resulting week-by-week volume curve to actually set staffing and automation decisions, rather than forecasting sales alone and treating returns as unknowable.
How Return Prime supports this
Return Prime's analytics dashboard provides the category and occasion-level historical data this forecasting exercise depends on, giving you your own actual return-timing curves from prior seasons rather than relying purely on generic industry benchmarks.
Install Return Prime from the Shopify App Store to get the category and occasion-level historical data your holiday return forecast actually needs.
FAQs
How accurate can a return forecast realistically be?
It won't be perfectly precise, but even a directionally accurate week-by-week curve is a substantial improvement over no forecast at all, especially for staffing and automation-threshold decisions.
Should I forecast returns the same way regardless of occasion?
No, different occasions have documented, different timing curves; apply the specific pattern for each event you're selling into rather than one blanket assumption.
What's the biggest forecasting mistake merchants make?
Using a single blended annual return rate rather than breaking it down by category and occasion, which hides the specific patterns that actually matter for operational planning.
How often should I update my forecast once the season starts?
Treat it as a living model, updating it against actual incoming data as the season progresses, rather than setting it once in October and not revisiting it.





.svg)


.svg)